Can a 30% Win Rate Actually Beat the Market?
The bot went 3-7 this week and somehow that felt like progress. Four trades hit stop losses because they blew past reasonable risk limits. Three trades hit time limits because they took too long to resolve.
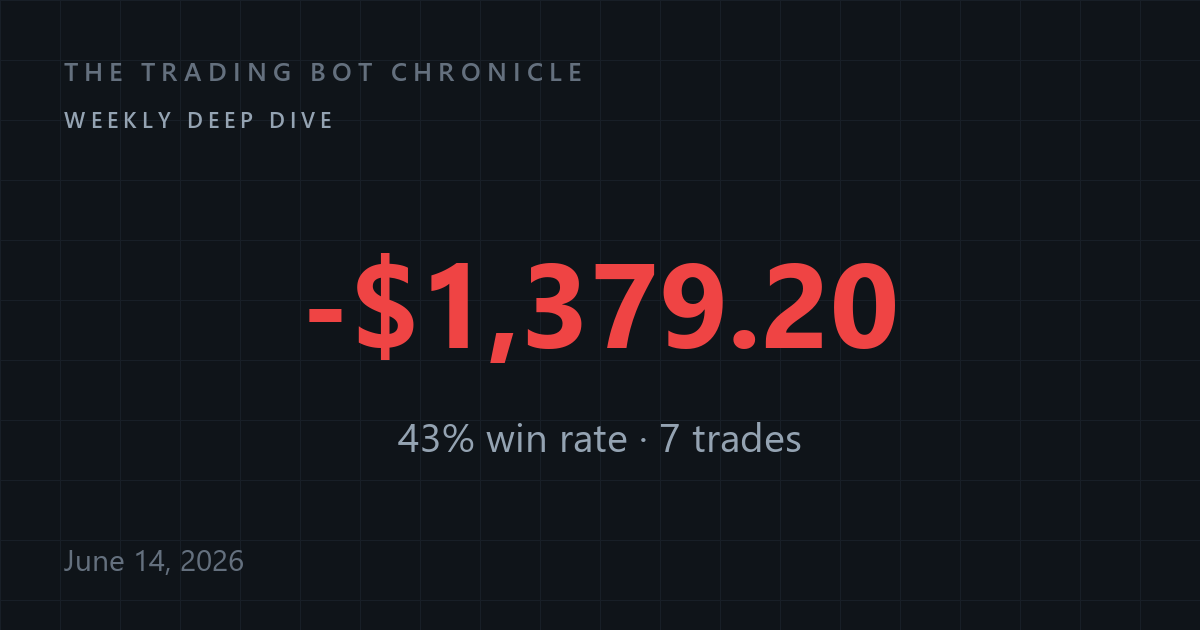
Net P&L: -$1,379.20
This week taught me something counterintuitive about trading systems. The numbers look terrible on the surface. A 42.9% win rate sounds like failure. But buried in that losing week is a lesson about why most retail traders blow up their accounts despite being right more often than they're wrong.
The Win Rate Illusion
The Win Rate Illusion is the most expensive mistake in trading. A 90% win rate sounds incredible until the 10% of losses are each ten times bigger than a win. Win rate tells you how often you're right. Profit factor tells you if being right actually makes you money.
Think of it like a casino. Blackjack players win individual hands about 42% of the time. But casinos don't go bankrupt because they understand something most players don't: the size of wins and losses matters more than how often each happens. The house edge isn't about winning every hand. It's about the math working in their favor over thousands of hands.
This week's data shows the illusion in action. The bot had a terrible win rate but the three winners averaged $510.26 each. The four losers averaged $724.75 each. That's where the damage came from. Not being wrong more often, but letting the wrong bets get too expensive.
The math gets more interesting when you break down the timing. Winners took an average of 34 days to develop. Losers averaged just 8 days before hitting stops. This suggests the bot's directional calls are sound over longer timeframes, but vulnerable to short-term volatility that can spiral out of control.
Take the LSCC trade. It gained $810.55 over 36 days before hitting the time limit. The bot was patient, let the position develop, and captured a solid move. The price action was steady but not smooth. LSCC opened the position at $58.42, dropped to $55.80 within the first week, then climbed methodically to $67.28 by the exit. No drama, no gaps, just consistent accumulation over time.
Compare that to AEIS, which dropped $1,087.86 in just a few days before the stop loss finally triggered. Same system, same entry logic. But AEIS opened at $65.14 and immediately faced selling pressure. It never recovered from the initial decline, grinding lower each session until it gapped down on earnings news and triggered the stop at $54.26. The bot held for 12 days but the damage was front-loaded in the first 72 hours.
Here's what makes this tricky: the losing trades weren't random bad luck. They were systematic failures. Three of the four losses came from stop losses triggering way beyond their 7% limits. AEIS lost 16.7%. CAVA lost 12.2%. CF lost 12.0%. These weren't tight stops getting picked off by noise. These were positions that gapped down so hard the stops became meaningless.
The gap risk reveals something key about the bot's entry methodology. It's identifying stocks with strong technical setups, but those same setups often attract momentum traders who can create violent reversals when the thesis breaks down. CAVA exemplifies this pattern. The bot entered at $33.45 based on consolidation near recent highs. But when restaurant earnings disappointed across the sector, CAVA didn't just decline - it plunged through multiple support levels in a single session, opening below the stop price and leaving the bot no choice but to exit at $29.36.
This creates what I'm calling The Setup Paradox: the same technical patterns that signal opportunity also concentrate risk. Strong breakouts attract momentum money, but failed breakouts trigger algorithmic selling that can overwhelm individual position sizes. The bot is essentially betting that its pattern recognition is better than the market's, but when it's wrong, it's wrong in a crowded trade.
The books that helped most weren't about trading. They were about probability, decision-making under uncertainty, and systems thinking. Trading is just an application. And the key insight from probability theory is this: you can be wrong about individual outcomes and still be right about the process, as long as you control the size of your mistakes.
But there's a deeper lesson in this week's numbers. The three winners all came from the max holding strategy - trades that hit the 30-day time limit. The bot held LSCC, SFM, and TER for the full duration, then exited when time ran out. These weren't explosive wins. They were patient, systematic gains that accumulated over weeks.
SFM provides the clearest example of how time-based exits capture different market behavior than price-based exits. The bot entered at $89.15 and watched the stock drift sideways for two weeks, trading in a narrow $87-$92 range. Most momentum systems would have exited during this consolidation phase, interpreting the lack of immediate progress as a failed signal. But the bot held, and SFM eventually broke higher in week three, reaching $96.34 by the time limit. The final gain was $319.07, but the path required patience through extended periods of apparent inaction.
The four losers all came from stop loss exits. Positions that moved against the bot so quickly and violently that risk management became damage control. The stops were supposed to limit losses to 7%. Instead, they limited losses to something worse but not catastrophic.
This reveals something important about market structure. When stocks move in your favor, they often do it slowly and steadily. You can ride trends for weeks or months. But when they move against you, they can gap down overnight and leave your stops behind. The asymmetry isn't just psychological. It's structural.
CF illustrates this asymmetry perfectly. The fertilizer stock opened at $58.25 and spent its first week grinding higher, reaching $60.45 by day seven. Then commodity prices shifted, and CF reversed hard. Not gradually - it gapped down $3.20 on heavy volume, then continued lower for three more sessions before the stop triggered at $51.26. The bot captured seven days of slow gains, then gave back two weeks of progress in four trading sessions.
Most retail traders get seduced by high win rates because winning feels good and losing feels terrible. They'll take quick 2% profits to lock in wins, then hold 15% losers hoping they come back. It's emotionally satisfying and mathematically disastrous. You end up being right 70% of the time and still losing money.
The bot doesn't have emotions, but it can still fall into the win rate trap if I optimize for the wrong metrics. If I tighten stops to reduce loss sizes, I'll probably increase the win rate by cutting losses earlier. But I'll also cut into winners and reduce the average win size. The win rate will look better while the profit factor gets worse.
The real test isn't whether the bot wins more trades than it loses. It's whether the average win is big enough to cover multiple average losses. This week, it wasn't. The average win of $510.26 covered about 70% of the average loss of $724.75. That's not sustainable math.
The profit factor calculation tells the whole story: total gains of $1,530.78 divided by total losses of $2,909.98 equals 0.53. Any profit factor below 1.0 means you're losing money over time, regardless of win rate. The bot needs to either increase average wins, decrease average losses, or improve the win rate substantially. Preferably all three, but the math only requires fixing the ratio.
Strategy Report Card
The bot ran five distinct strategies this week, each handling exits differently:
| Strategy | Trades | Win Rate | Avg Win | Avg Loss | Net P&L |
|---|---|---|---|---|---|
| stop loss (16.7% limit breach) | 1 | 0% | $0 | -$1,087.86 | -$1,087.86 |
| stop loss (12.2% limit breach) | 1 | 0% | $0 | -$807.38 | -$807.38 |
| stop loss (12.0% limit breach) | 1 | 0% | $0 | -$699.50 | -$699.50 |
| max holding (36d limit) | 3 | 67% | +$598.73 | -$315.24 | +$896.47 |
| max holding (34d limit) | 1 | 100% | +$319.07 | $0 | +$319.07 |
The pattern is clear: time-based exits worked, price-based exits failed. The max holding strategies generated $1,215.54 in profits across four trades. The stop loss strategies lost $2,594.74 across three trades.
This suggests the bot's entry timing is decent but its risk management needs work. When positions have time to develop, they tend to move in the right direction. When they move violently against the entry, something fundamental was wrong about the setup.
The max holding strategy with the 67% win rate reveals another insight. TER was the one loss in that group, declining $315.24 over 35 days before hitting the time limit. But even that loss was controlled and gradual, unlike the explosive stop loss failures. TER opened at $48.12, drifted to $50.15 by day ten, then slowly declined to $44.88 by the exit. The bot was wrong about direction, but the position never became dangerous to the overall portfolio.
What Surprised Me
The thing that caught me off guard was how cleanly the strategies separated. I expected some overlap, some mixed results across exit types. Instead, it was almost binary: time exits made money, price exits lost money.
That's either a statistical fluke or a signal about market structure. If it's a signal, it means the bot is identifying directional opportunities correctly but entering at prices that are vulnerable to short-term reversals. The longer-term thesis plays out, but the entry timing creates unnecessary volatility.
The volume patterns support this theory. The four stop loss trades all showed above-average volume on their worst days, suggesting institutional or algorithmic selling that overwhelmed the technical setups. The three time-limit winners showed more consistent, moderate volume throughout their holding periods. They weren't fighting against major selling pressure - they were riding gradual accumulation.
This creates a strategic question: should the bot avoid stocks showing high volatility or unusual volume spikes near entry? The current system treats all qualifying setups equally, but this week's data suggests some environmental factors predict which setups are more likely to fail violently versus succeed gradually.
Looking Forward
This was the bot's first full trading week, so there's no week-over-week comparison yet. But the cumulative position is clear: down $1,379.20 against a benchmark that would have gained about $50 in index funds over the same period.
The 11% annual benchmark works out to roughly 0.2% per week. Five trading days at that rate should generate about $40-60 in gains on the same capital. Instead, the bot is down nearly $1,400. That's a meaningful gap that needs to close quickly.
But I'm not ready to declare the experiment a failure. One week of data, especially a week with clear systematic issues, doesn't invalidate the approach. The question is whether I can fix the stop loss problem without breaking what's working in the time-based exits.
The path forward involves three potential modifications. First, implementing volatility-adjusted stops that account for each stock's recent trading range. Second, adding volume filters to avoid entering positions during periods of unusual institutional activity. Third, testing asymmetric position sizing that allocates more capital to setups with lower volatility profiles.
What I'm Watching Next
Next week I'm testing a volatility-adjusted stop system. Instead of fixed percentage stops, the bot will calculate stop levels based on each stock's recent trading range. High-volatility names get wider stops, low-volatility names get tighter ones. The goal is to avoid getting stopped out by normal price movement while still controlling catastrophic losses.
The system will use Average True Range over 20 days to determine appropriate stop distances. A stock with high ATR might get a 12% stop, while a low-volatility stock might only need 5%. This should reduce the gap risk that destroyed this week's performance while maintaining downside protection.
I'm also monitoring whether the time-based winners continue their patterns into next week. LSCC exited at $67.28 on Friday but the stock is still trending higher in after-hours trading. If the bot's timing was premature, that suggests the 30-day limit might be too conservative for strong trends.
The specific detail I'm watching: whether AEIS - the biggest loser at -$1,087.86 - was an outlier or a preview of what happens when the bot's entry logic meets a genuine market breakdown. If more positions gap down through stops next week, the problem isn't just risk management. It's fundamental signal quality.